
Stock Analysis for Crypto: The Beginner’s Secret to Cutting Through Noise

Navigating the Noise: Why Stock Insights Matter for Crypto Beginners
Starting your journey into crypto can feel like stepping into a wall of sound.

News alerts ping, prices flash, and everyone seems to be shouting about the next big coin. For a beginner, it’s overwhelming. Where do you even look to make sense of it all?
Here’s a surprising secret: one of the clearest signals for understanding crypto might not come from a crypto chart at all. It often comes from the stock market.
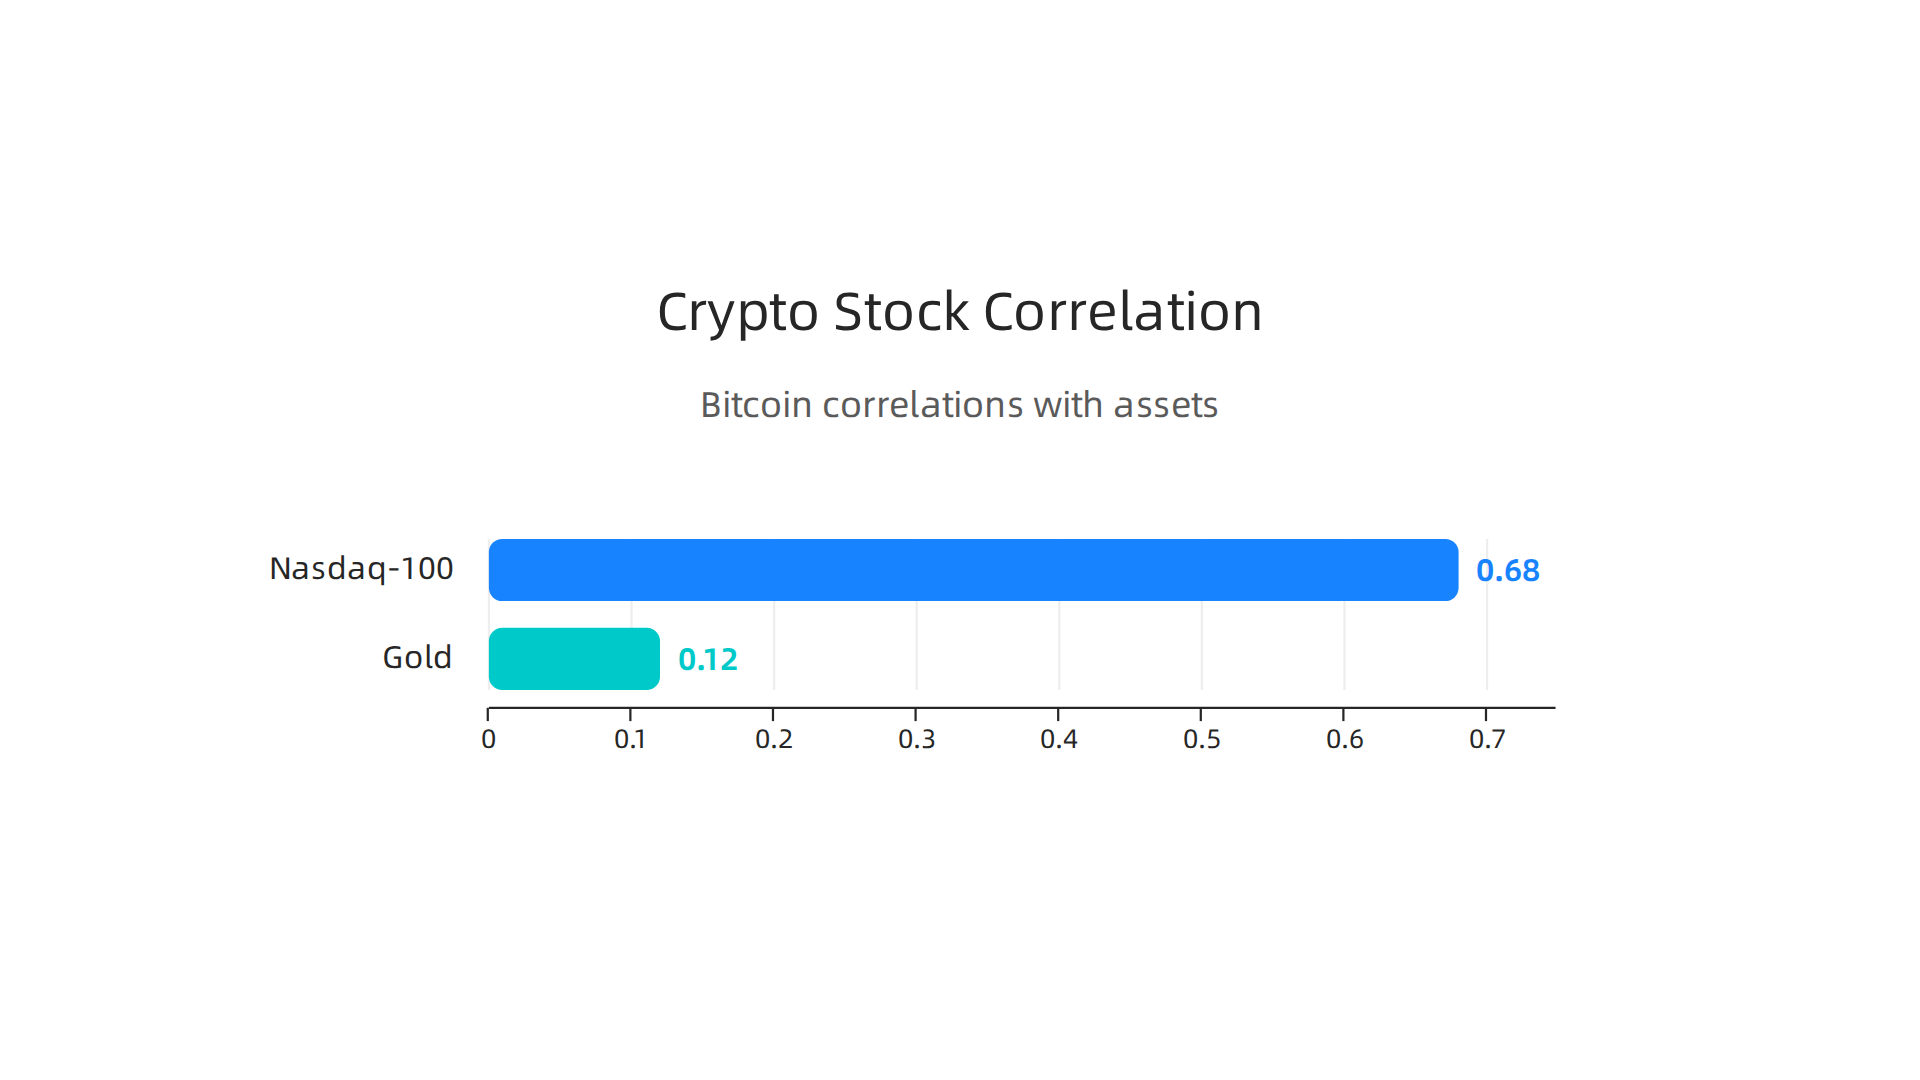
You see, crypto and tech stocks have become neighbors in the financial world. They don’t move in lockstep, but they often feel the same weather. When tech giants like Meta stock or the companies in the QQQ stock ETF have a good or bad day, it can ripple out to digital assets. Recent analysis shows that Bitcoin’s price movement is now more closely tied to tech stocks than to traditional safe havens like gold. For instance, in early 2025, Bitcoin’s 90-day correlation with the Nasdaq-100 reached 0.68, a much stronger link than its 0.12 correlation with gold.
This happens for a few reasons. Big institutional money now flows into both markets. They react to the same big economic forces, like what the Federal Reserve decides about interest rates. As one report notes, higher interest rates have changed the trajectory of stocks, bonds, and cryptocurrency alike. When investors get nervous about tech earnings or economic growth, that sentiment can wash over from stocks into crypto.
This connection means you don’t have to understand everything at once. By learning to read the basic moods of the stock market—especially the tech sector that includes names like Palantir stock (PLTR) and MicroStrategy stock (MSTR)—you build a foundational layer of confidence. You start to see patterns. You understand why the crypto market might be up or down on a given day, not because of some mysterious crypto-only reason, but because of broader financial trends.
Think of it this way. If you see headlines that Meta stock plunged after its earnings report, you might notice Bitcoin and Ethereum feeling shaky too. It’s not a perfect predictor, but it’s a clue. It helps you filter the noise. Instead of chasing every crypto rumor, you can start with a simpler question: “What’s the overall market sentiment today?”
This approach cuts through the complex jargon and gives you a steadier starting point. It’s about building knowledge from a familiar foundation outward.
If you’re looking for a straightforward way to connect these dots and get clear, beginner-friendly guidance, consider subscribing to our free newsletter at Clicks and Trades.

We break down these market connections into simple, step-by-step insights to help you navigate with more confidence. Sign up here to get started.
Decoding Meta (META): A 2026 Snapshot for the Curious Investor
So, you see a headline that Meta stock is up or down, and you wonder what it really means.

Is it just about Facebook and Instagram ads? In 2026, the answer is much bigger, and understanding it can give you a clearer lens for the whole market.
Beyond the Feed: AI and the Metaverse
Today, Meta is two companies in one. The first is the giant you know: the family of apps (Facebook, Instagram, WhatsApp) that makes money from digital advertising. This is the engine that funds everything else.
The second is its ambitious future, built on two pillars: Artificial Intelligence (AI) and the Metaverse (housed in its Reality Labs division). AI powers everything from the ads you see to new creative tools. The Metaverse represents a long term bet on a new kind of digital world. For investors, the story is about how much profit the ad business can generate to fund these expensive future bets.
What to Watch (Beyond the Stock Price)
The stock price tells you what the market feels. These numbers tell you why. Here are two simple metrics to keep an eye on:
- Revenue Growth: This shows if the core business is still healthy and expanding. For example, Meta’s Q4 2025 revenue hit $59.9 billion, a strong 24% increase from the year before. Consistent growth here is a good sign of stability.
- Reality Labs Investment: This is where Meta spends heavily on the Metaverse. Watch for updates on how much is being invested and what progress is being made. Large losses here are expected for now, but investors want to see a path to future innovation.
Think of it like this: strong revenue from apps pays the bills today. Strategic spending on AI and the Metaverse is the investment in tomorrow.
Reading the Sentiment Around Meta Stock
Positive or negative news typically falls into two buckets:
- The Core Business is Strong: News about beating earnings expectations, growing user numbers, or successful new ad products is usually positive. It shows the money-making machine is humming. For instance, when Meta’s full-year 2025 revenue reached $201 billion, it confirmed the strength of its core operations.
- Spending Worries or Excitement: This is all about the future. If investors get nervous that Meta is spending too much on the Metaverse with few results, the stock might dip. Conversely, a breakthrough demo in AI or a popular new virtual reality product can create excitement and lift the stock.
For a beginner, this is your filter. Next time you see "Meta stock surges" or "Meta stock falls," ask: Is this about its money-making today, or its spending on tomorrow?
Understanding this one company gives you a framework. You can start to see how other tech giants balance current profits with future bets.

This knowledge helps you make sense of broader market moves, whether you’re looking at QQQ stock, Palantir stock (PLTR), or even the crypto market that often follows tech’s lead.
Want to see how these big-picture ideas apply to your own journey? Our free newsletter at Clicks and Trades breaks down market connections into clear, step-by-step insights. We help you turn news headlines into understanding. Sign up here to get started.
Beyond the Ticker: Palantir and the Data-Driven Market
While Meta stock tells a story about balancing giant profits with future dreams, Palantir stock (PLTR) follows a different script.
Think of it this way: if Meta sells ads, Palantir sells answers.
It’s a company built for the age of big data. Governments and large businesses have oceans of information. Palantir’s software helps them navigate it, find patterns, and make decisions. In 2026, with AI everywhere, that job is more critical than ever. But for an investor, the story isn’t just about cool tech. It’s about two very specific things: contract growth and government business.
Why "Contract Growth" is the Lifeblood
For a software company like Palantir, new and expanding contracts are everything. They show the business is gaining trust and scale. Here’s what made headlines recently:
- Explosive U.S. Commercial Growth: In the last quarter of 2025, Palantir’s revenue from U.S. businesses skyrocketed 137% from the year before. This shows its tools are catching fire in the private sector.
- Ambitious Future Targets: The company’s own guidance for 2026 calls for total revenue growth of about 61%. For a company of its size, that’s a huge target and sets very high expectations.
When you see news about PLTR stock, often check if it’s about landing a big new customer or, conversely, if growth is slowing. Its stock price is tightly tied to hitting these aggressive expansion goals.
The Steady Engine: Government Business
Alongside its commercial push, Palantir has a deep, steady relationship with governments. This isn’t flashy, but it provides stability.
- In 2025, Palantir’s government segment revenue grew by 53%, bringing in $2.4 billion. This kind of large, durable contract work helps fund the company’s overall operations.
So, while the commercial side aims for hyper-growth, the government side acts as a solid foundation. A healthy Palantir story needs both engines running.
Meta vs. Palantir: Two Tech Paths
This shows us two distinct paths in the tech world:
- Meta (The Profit-Fueled Innovator): Uses massive current profits from social media to fund long-term bets on AI and the metaverse.
- Palantir (The Growth-Scaled Specialist): Rides the wave of AI and data demand, but its stock story relies almost entirely on proving it can grow its customer base and revenue at an exceptionally high rate year after year.
Understanding this difference helps you decode the market. A dip in QQQ stock (a tech-heavy ETF) might hit both, but for different reasons. Meta might fall on metaverse spending fears, while Palantir might drop on concerns about its growth pace.
This connection even extends to other corners of the market. Major tech trends influence everything. For example, there’s a notable link between tech stocks and crypto. As one analysis points out, Bitcoin’s price movements have shown a stronger correlation with tech indexes like the Nasdaq than with traditional safe havens like gold. This means when big tech rallies or falls, it often pulls other speculative assets, like cryptocurrency, along with it.
Getting a handle on these narratives—profit engines vs. growth scalers—helps you make sense of more than just one stock. It gives you a lens for understanding movements in related areas, from AI software stocks to the broader crypto market.
Feeling overwhelmed by how all these market pieces connect? You’re not alone. We break down these complex topics into clear, step-by-step insights. For more straightforward guidance on navigating these connections, sign up for our free newsletter.
The Bridge: Translating Stock Analysis Skills to Crypto
You’ve just seen how analyzing a stock like Meta or Palantir stock (PLTR) means looking at things like revenue growth and contracts. So, how does that help you with something like Bitcoin? At first glance, they seem like different worlds. But here’s the good news. The skills you use to understand stocks are a secret decoder ring for crypto.

You don’t have to start from zero. You just need to learn how to translate the concepts you already know.
From P/E Ratios to Tokenomics
In the stock market, you look at a company’s fundamentals. For Meta stock, that might mean its price-to-earnings (P/E) ratio, which compares its stock price to its profits. For a growth stock like PLTR, you focus on its projected revenue growth, like its ambitious 61% target for 2026.
In crypto, the closest idea is "tokenomics." Think of it as the fundamental economic rules of a cryptocurrency. Instead of asking "How much profit does this company make?", you ask:
- What is the token’s total supply? Is it limited like Bitcoin, or can more be created?
- How is the token used? Is it needed to pay for services on its network?
- Who holds the tokens? Is the supply concentrated in a few wallets, or spread out?
Analyzing MSTR stock (a company that holds a lot of Bitcoin) teaches you about Bitcoin’s value as a digital asset. That thinking directly applies to evaluating any cryptocurrency’s tokenomics. It’s about understanding the supply, demand, and utility, just like you would with a company’s products.
Reading "Market-Moving" News in Both Worlds
News moves prices in both markets. The framework for understanding it is similar.
When Palantir stock jumps on a news of a big new government contract, you understand that means future revenue. When a crypto project announces a major partnership or a technical upgrade, it’s the same idea. It’s news that could increase future adoption and usage.
When the Federal Reserve talks about interest rates, it can affect QQQ stock (the tech-heavy ETF) and Bitcoin’s price at the same time. Why? Because both are seen as growth-oriented, risk-on assets. Big economic news creates waves that wash over both stock and crypto shores. Learning to see these connections helps you anticipate movements.
Start with Stocks, Then Explore Crypto
Here is a practical tip from experienced analysts. Before diving into the deep end of volatile crypto assets, build your analytical muscles with more established companies.
Start by following a blue-chip stock like Meta stock. Watch how its price reacts to earnings reports, product launches, and CEO statements. Get comfortable reading basic financial headlines. This practice grounds you in how markets digest information.
Once you have that foundation, applying it to crypto feels less foreign. You’ll look at news about a cryptocurrency and ask, "Does this change its fundamental use case or adoption potential?" instead of just reacting to price hype.
The journey from understanding ares capital stock to analyzing bitfarms stock is about connecting different pieces of the modern financial puzzle. The core skill is critical thinking, and it’s transferable.
Feeling more confident about building these connections? For clear, step-by-step guidance that breaks down complex topics into simple insights, consider joining our free community. Sign up for the Clicks and Trades newsletter to get straightforward crypto education and market tips delivered to you.
The Visual Investor’s Toolkit: Simplifying Complex Data
Have you ever opened a stock chart and felt your brain shut down? Lines zigzagging everywhere, ten different colored indicators, numbers flashing. It’s too much. You just wanted to see if Meta stock was trending up or down.
You’re not alone. A cluttered chart creates what experts call a high "cognitive load." It’s a fancy term for mental overwhelm. When there’s too much information, your brain can’t process what’s important. This confusion is one of the biggest hurdles for new investors. It can lead to rushed decisions or, worse, no decision at all because you’re paralyzed by the noise.
The good news? You don’t need all that noise. Effective investing is about clarity, not complexity. Let’s build your visual toolkit with a few simple, powerful ideas.
Simple Visualizations That Actually Work
Forget the dozen-indicator charts. Start with these two clear views to track trends in Meta stock or major cryptocurrencies like Bitcoin.
1. The Clean Price Trend with a Moving Average
This is your foundational view. It shows the actual price (often a candlestick or line) with just one extra layer: a moving average line. A 50-day or 200-day moving average smooths out the daily bumps and shows you the underlying trend. Is the price above the moving average? That’s generally a good, upward trend. Is it below? That might suggest a downward trend. This simple overlay cuts through the minute-by-minute chaos and answers your core question: "What’s the general direction?"
2. The Volume Bar Chart
Price tells you what happened. Volume tells you how strongly it happened. A simple bar chart at the bottom of your screen showing trading volume is incredibly powerful. If Meta stock jumps 5% on huge volume, that’s a stronger, more confirmed move than a 5% jump on tiny volume. It helps you spot real momentum versus random flickers. Just like in academic research where data is used to analyze specific trends, focusing on key, persistent signals is what matters.
What Data Deserves the Spotlight?
Moving beyond the noise means knowing what to ignore and what to watch. Here are the key points that deserve your attention, whether you’re looking at QQQ stock, PLTR stock, or Bitcoin.
- Support and Resistance Levels: These are not complex formulas. They are simply price levels where the asset has repeatedly bounced upward (support) or dropped downward (resistance). Drawing a couple of horizontal lines on your chart at these levels gives you a map of where the market might react next.
- Major Trend Changes: Instead of watching every wiggle, zoom out. Look for clear breaks above a long-term moving average or below a key support level. These are the signals that matter for bigger moves.
- Context from Related Assets: Is the entire tech sector (look at QQQ stock) moving up or down? That context will heavily influence Meta stock. Similarly, is Bitcoin moving? That will affect coins and stocks like MSTR stock or bitfarms stock. A single asset rarely moves in a vacuum.
Platforms that understand this need for clarity are changing the game for beginners. Instead of overwhelming dashboards, they offer clean views that highlight these key signals, helping you understand the "why" behind a move in plain language. This strategic, evidence-based approach to presenting information helps reduce duplication of effort and focuses on what’s impactful.
Building this visual discipline stops you from reacting to every flicker on the screen. You start making decisions based on cleaner, more reliable pictures of the market.
Ready to cut through the noise and see the market clearly? For straightforward guidance that turns complex charts into simple insights, Sign up for the Clicks and Trades newsletter. It’s your free resource for step-by-step visual tips and clear market understanding.
Risk Management: The Universal Lesson from Stocks to Crypto
Now that you can see the market clearly, the next step is learning how to protect yourself within it. A clean chart for Meta stock or Bitcoin shows you the opportunity, but risk management is what keeps you in the game long enough to capture it. This discipline is the same, whether you’re dealing with tech giants or digital assets.
How Diversification Works in a Mixed Portfolio
You’ve probably heard "don’t put all your eggs in one basket." But what does that basket look like when it holds both Meta stock and Bitcoin?

The core idea is the same: spread your risk. However, how they move together, or don’t, is key.
- Traditional Diversification: Owning Meta stock, PLTR stock, and an ETF like QQQ stock spreads your risk across different companies within the tech sector. If one has bad news, the others might not be affected as severely.
- Cross-Asset Diversification: Adding Bitcoin or MSTR stock (a stock heavily tied to Bitcoin) introduces a different type of asset. Historically, crypto has moved independently of stock markets at times. During certain market events, while tech stocks might dip, Bitcoin could hold steady or even rise. This non-correlation can smooth out your portfolio’s overall ride.
But here’s the catch. True diversification means understanding what drives each asset. Don’t just buy five different tech stocks and Bitcoin and think you’re diversified. That’s like having five eggs in one cardboard basket and one egg in a steel basket. You need a mix of baskets. Research from State Street Global Advisors notes that modern investors are increasingly using tools like ETFs to achieve this blend of traditional and alternative assets for better risk management.
The Emotional Cycle: Recognizing FOMO and Panic
Your biggest risk isn’t always the market. It’s your own psychology. The emotional rollercoaster is identical whether you’re watching Meta stock soar or Bitcoin crash.
- FOMO (Fear Of Missing Out): This hits when prices are screaming upward. You see ares capital stock making big moves or Bitcoin hitting a new high, and you rush in without a plan, afraid the train is leaving without you. Studies on novice investors consistently link overconfidence and the urge to chase performance to poorer decision-making.
- Panic Selling: This is the mirror image. When a holding like Bitfarms stock or your Meta stock investment drops 15% in a week, fear takes over. The rational plan you made evaporates, and you sell at a loss just to make the pain stop.
These are not just feelings. They are documented behavioral biases. Experts point out there are over 150 cognitive biases that can impact investment decisions, with overconfidence and loss aversion being primary culprits during market extremes.
The Cost of Emotional Decisions: A Clear Case
Let’s look at the data. Analysis of market downturns repeatedly shows a stark pattern: investors who abandon their planned strategy for emotional reactions suffer significantly greater losses.
For instance, during a volatile period, an investor might have held a balanced plan with Meta stock and a small, strategic position in Bitcoin. A planned strategy would have predetermined points to buy more or steps to limit losses. An emotional investor, driven by headlines and fear, might sell all their Bitcoin at a steep loss and then sell their Meta stock at a low, locking in losses across their portfolio. Research on behavioral finance confirms that this cycle of emotional buying high and selling low is a major wealth destroyer, far more damaging than typical market volatility itself.
The universal lesson? Your risk management plan must include rules for your own behavior. Write down your strategy for entering and exiting positions before you invest. Decide what you will do if Meta stock falls by 10% or if Bitcoin doubles. This turns you from a reactive participant into a disciplined manager of your own capital.
Building this discipline is a continuous process. For straightforward insights on managing risk and building a resilient mindset for both stocks and crypto, Sign up for the free Clicks and Trades newsletter. It delivers clear, actionable guidance to help you stay calm and stick to your plan.
Building a Trustworthy Information Diet
Your risk management plan is only as strong as the information you feed it. After learning to manage your emotions, the next critical skill is learning to manage your inputs. In a world overflowing with headlines screaming about Meta stock surges or Bitfarms stock crashes, your success depends on filtering the signal from the noise. A trustworthy information diet protects you from hype and guides you toward clarity.
Spotting Red Flags: Sensationalism vs. Substance
The first step is learning to identify low-quality information. This is true whether you’re researching ares capital management or a new cryptocurrency.
- The "Too Good to Be True" Headline: If a title promises guaranteed returns or uses excessive urgency ("BUY NOW BEFORE IT’S TOO LATE!"), treat it as entertainment, not advice. Serious analysis of PLTR stock or QQQ stock discusses potential, not promises.
- Anonymous or Unqualified Sources: Who is behind the analysis? A credible source is transparent about their credentials and potential biases. An anonymous social media account pumping BTC stock ideas has no accountability.
- Lack of Data or Evidence: Does the article or video show its work? Reliable analysis will cite earnings reports, on-chain data for crypto, or technical levels. If it’s all opinion with no supporting charts or numbers, it’s likely just noise.
The U.S. Securities and Exchange Commission (SEC) consistently warns investors to verify their information sources.
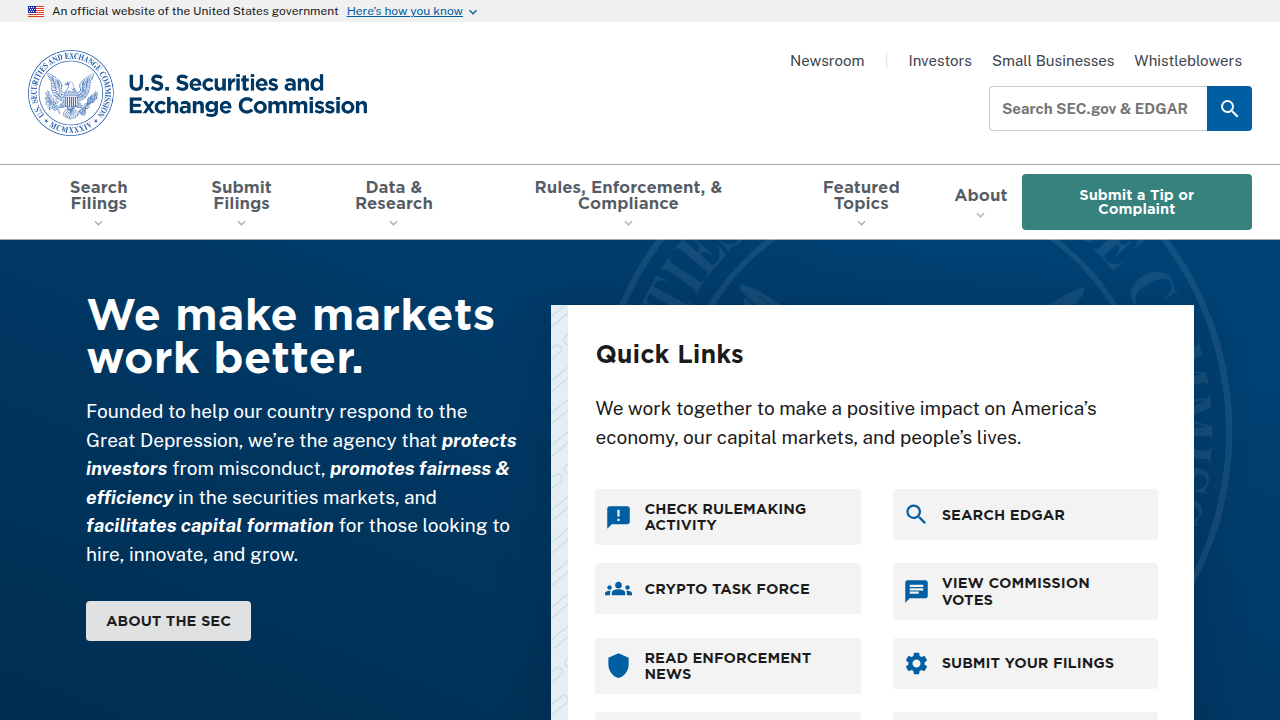
Their 2026 investor bulletin emphasizes the importance of using official resources like Investor.gov to build a foundation of knowledge, a key step in spotting misleading claims elsewhere.
Curating Your Starter Kit of Reliable Sources
You don’t need to follow a hundred experts. You need a short, high-quality list. Here is a simple framework to build yours.
- Primary Sources (The Gold Standard): This is data straight from the source. For Meta stock, it’s the company’s quarterly earnings reports and SEC filings. For Bitcoin, it’s the blockchain itself or summaries from established data aggregators. This is your fact-check.
- Regulatory & Educational Hubs: Bookmark sites from organizations tasked with investor protection and education. The SEC’s official website is a prime example, offering a wealth of unbiased educational materials. The SEC’s 2026 examination priorities also reaffirm its focus on ensuring advisors act in clients’ best interests, highlighting the importance of trustworthy guidance.
- Reputable Financial News: Choose one or two major financial news outlets known for rigorous journalism. They provide context and broader market analysis that helps you understand why MSTR stock or the tech sector might be moving.
- Beginner-Friendly Analysis Platforms: Seek out platforms designed for clarity, not confusion. Look for services that prioritize visual simplicity and plain-English explanations over complex jargon. The goal is to understand the "why" behind a price move, not just the "what."
The Transparency Test: Always Check for Citations
Before you trust any analysis, do a simple check. Look for the links, references, or data points that support the conclusion.
- A trustworthy article about Palantir stock will link to the company’s latest press release or financial statement.
- A credible crypto update will reference specific blockchain metrics or provide a chart from a known data provider.
- A reliable market summary will mention if it’s referencing Federal Reserve statements or major economic reports.
If you can’t trace the key claims back to a verifiable source, the analysis lacks integrity. Transparency is the hallmark of credible information. As noted in analyses of the financial advice landscape, the duty to act in a client’s best interest is paramount, and that starts with clear, evidence-based communication.
Building this habit transforms you from a passive consumer of news into an active, discerning investor. You’ll spend less time sifting through panic-inducing headlines and more time understanding real trends. For a regular dose of clear, step-by-step guidance on navigating markets without the overwhelm, consider a curated resource. You can sign up for the free Clicks and Trades newsletter for straightforward insights delivered to your inbox.
Summary
This article explains why beginners in crypto should pay attention to the stock market—especially tech stocks—as a practical way to cut through the noise. It shows that big institutional flows and shared macro forces (like interest rates) often move tech equities and crypto together, so reading stock sentiment can give useful clues about crypto moves. The piece walks through two example names—Meta and Palantir—to show what metrics matter (revenue, investment levels, contract growth) and how their stories differ. It then explains how stock-analysis skills translate to crypto concepts like tokenomics, and offers a simple visual toolkit (moving averages, volume, support/resistance) to reduce cognitive overload. The article also covers risk management across stocks and crypto and gives rules for curating a reliable information diet. Overall, readers will learn clear, practical steps to interpret headlines, build disciplined habits, and make calmer, better-informed decisions in both markets.